

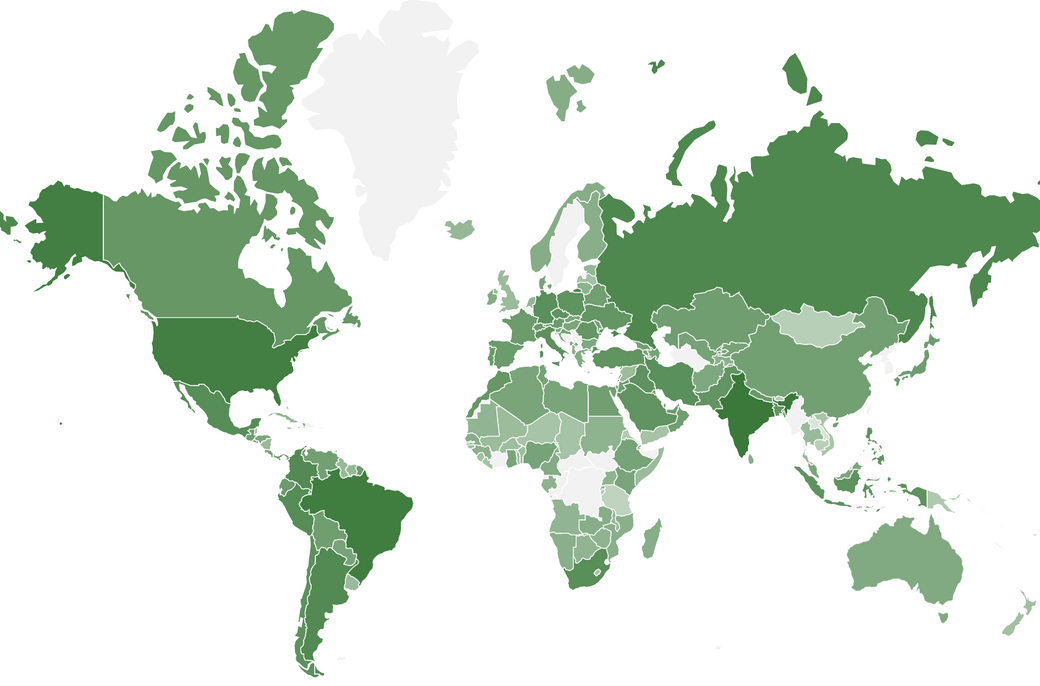
You're going to make a choropleth component like the one I used in WatchCOVID.org; that is, a choropleth map of confirmed global COVID-19 cases in React, and you'll be using SVG's to create the map and Johns Hopkins University CSSE Data Repository to populate it meaningfully. D3 will help us fetch the basemap, project the basemap, and fetch the case data.
During setup, you'll install these:
- D3: to fetch the data
- d3-geo: to project the basemap coordinates into a recognizable map
- topojson-client: to extract coordinates from the TopoJSON basemap
Reader: Not only the content, but the format of the data with which you'll be building a map in this tutorial changes rapidly. Please reach out if something doesn't work anymore so I can keep this updated.

Setup
- Open 2 tabs in terminal and navigate both to the folder where you're going to create your React project.
Tabs 1 & 2:
- Create a React project.
Tab 1:
$ npx create-react-app my-map-app
- Setup both tabs.
- Change the current working directory of both tabs to the project you've just created.
Tabs 1 & 2:
$ cd my-map-app
- In one tab, start the development build of your application. In the other, install the 3 NPM packages you'll be using:
D3,d3-geo, andtopojson-client.
Tab 1:
$ npm start
Tab 2:
$ npm install d3 d3-geo topojson-client
- Point your browser to
http://localhost:3000/. React should be rendering the<App />component by default.


- Clear out any stuff from App.js that nobody asked for.
From App.js
import React from 'react';
- import logo from './logo.svg';
import './App.css';

function App() {
  return (
    <div className="App">
-      <header className="App-header">
-         <img src={logo} className="App-logo" alt="logo" />
-        <p>
-          Edit <code>src/App.js</code> and save to reload.
-        </p>
-        <a
-          className="App-link"
-          href="https://reactjs.org"
-          target="_blank"
-          rel="noopener noreferrer"
-        >
-          Learn React
-        </a>
-      </header>
    </div>
  );
}

export default App;
Remove all the rules from App.css so you're left with just the class App.
App.css
- Create src/Map.jsx. Here's where you'll do your dirty work.
Your file structure should have these bones.
.
├── README.md
├── package-lock.json
├── package.json
├── public
└── src
    ├── App.css
    ├── App.js
    ├── Map.jsx
    ├── index.css
    └── index.js
- Import Map.jsx into App.js
App.js
  import React from 'react';
+ import Map from './Map';

  import './App.css';

  function App() {
    return (
      <div className="App">
+       <Map />
      </div>
    );
  }

  export default App;
- Define Map.jsx
Map.jsx
import React from 'react';

export default class Map extends React.Component {
  constructor(props) {
    super(props);
    this.state = {};
  }

  componentDidMount() {
  }

  render() {
    return (
      <div className="Map" >
      	MAPONENT
      </div>
    );
  }
}
Make a Map
You're going to import an open-source SVG basemap of the world's countries' borders. You'll fill these borders in with gradients of a color to present the distribution of COVID-19 cases. You'll use this 110 meter-quality map from the TopoJSON World Atlas repository. Here's the download URL:
https://cdn.jsdelivr.net/npm/world-atlas@2/countries-110m.json
Grab the Basemap TopoJSON
Import the TopoJSON into your Map component using D3, then log its contents to the console.
Map.jsx
  import React from 'react';

+ import * as d3 from 'd3';

  export default class Map extends React.Component {

    ...

+   componentDidMount() {
+     d3.json("https://cdn.jsdelivr.net/npm/world-atlas@2/countries-110m.json")
+       .then(json => {
+         console.log(json);
+       });
+   }

    ...
  }
Open your browser console to and expand the object you've just logged.
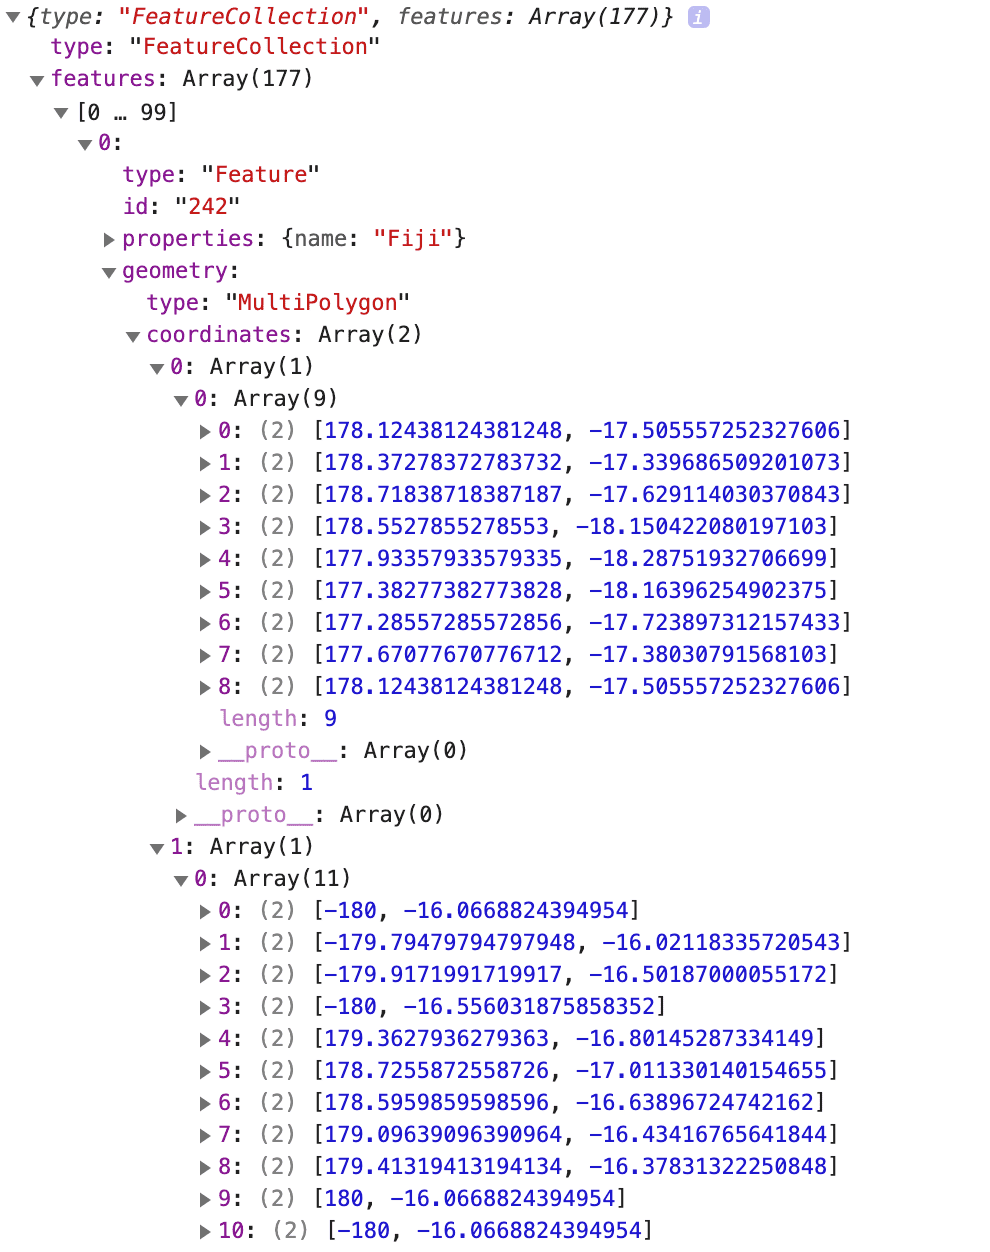
Expand (Object) > objects > countries > geometries:

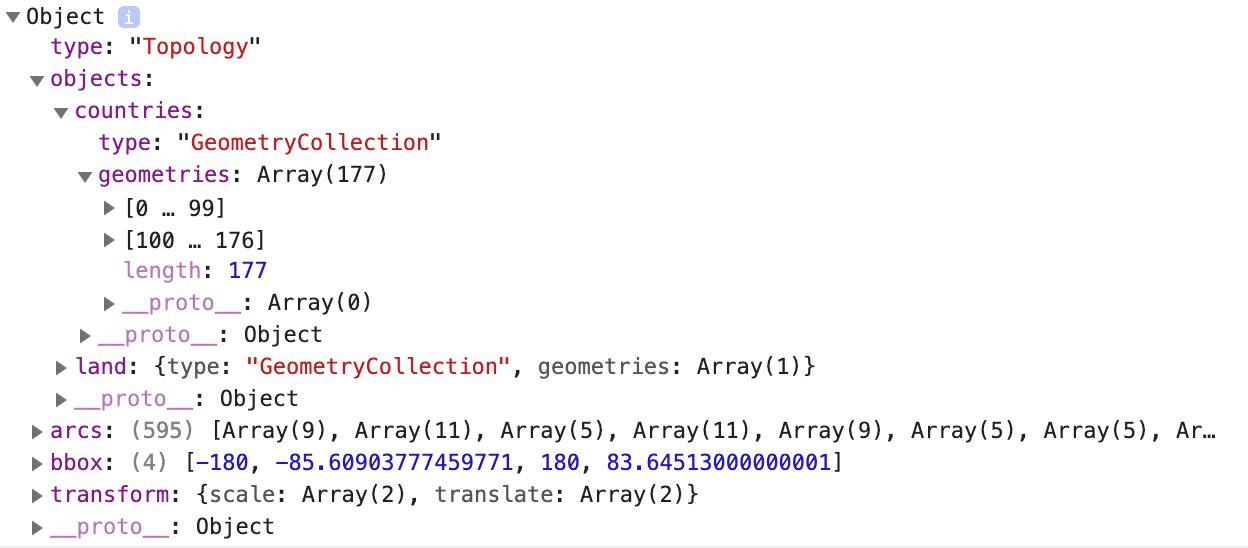
Notice the array under geometries has length 177. Those are distinct country entries, and because of your basemap is of the lowest resolution, you overlook some exceptionally small countries in this tutorial.
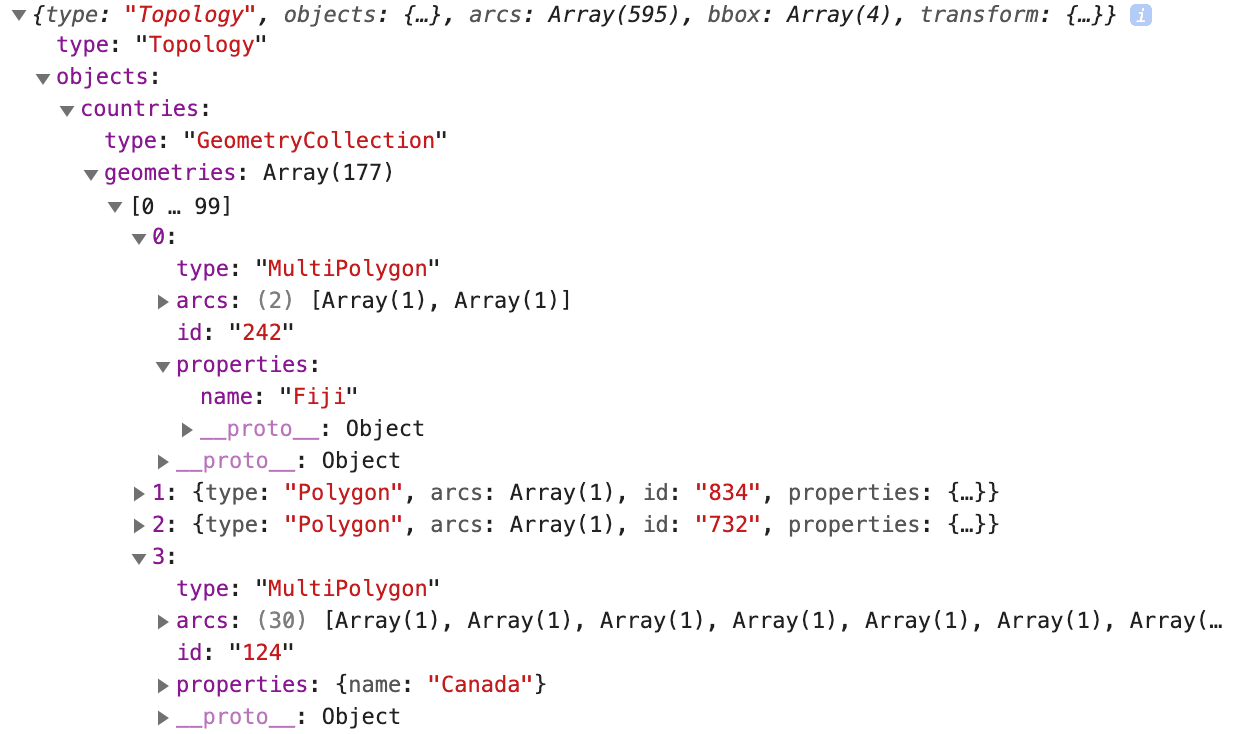
Now expand some of the geometries elements to find the country name associated with each entry. Try (Object) > objects > countries > geometries > 0 > properties, where you'll find the value name. You can log the 0th element's name by modifying the componentDidMount() callback (above) to instead log:
console.log(json.objects.countries.geometries[ 0 ].properties.name);

Convert the TopoJSON to Coordinates
If you look at the arcs field, you'll find an array of delta-encoded instructions on how to draw that particular polygon. The topojson-client package you downloaded turns the TopoJSON into a map you can recognize by converting the arcs to SVG paths.
If you're curious about how topojson-client helps, notice how the feature() function you'll import from topojson-client extracts the coordinates from the delta-encoded arcs by logging the following:
Map.jsx
+ import { feature } from "topojson-client"
   ...
    componentDidMount() {
      ...
+         console.log(feature(json, json.objects.countries));
      ...
    }

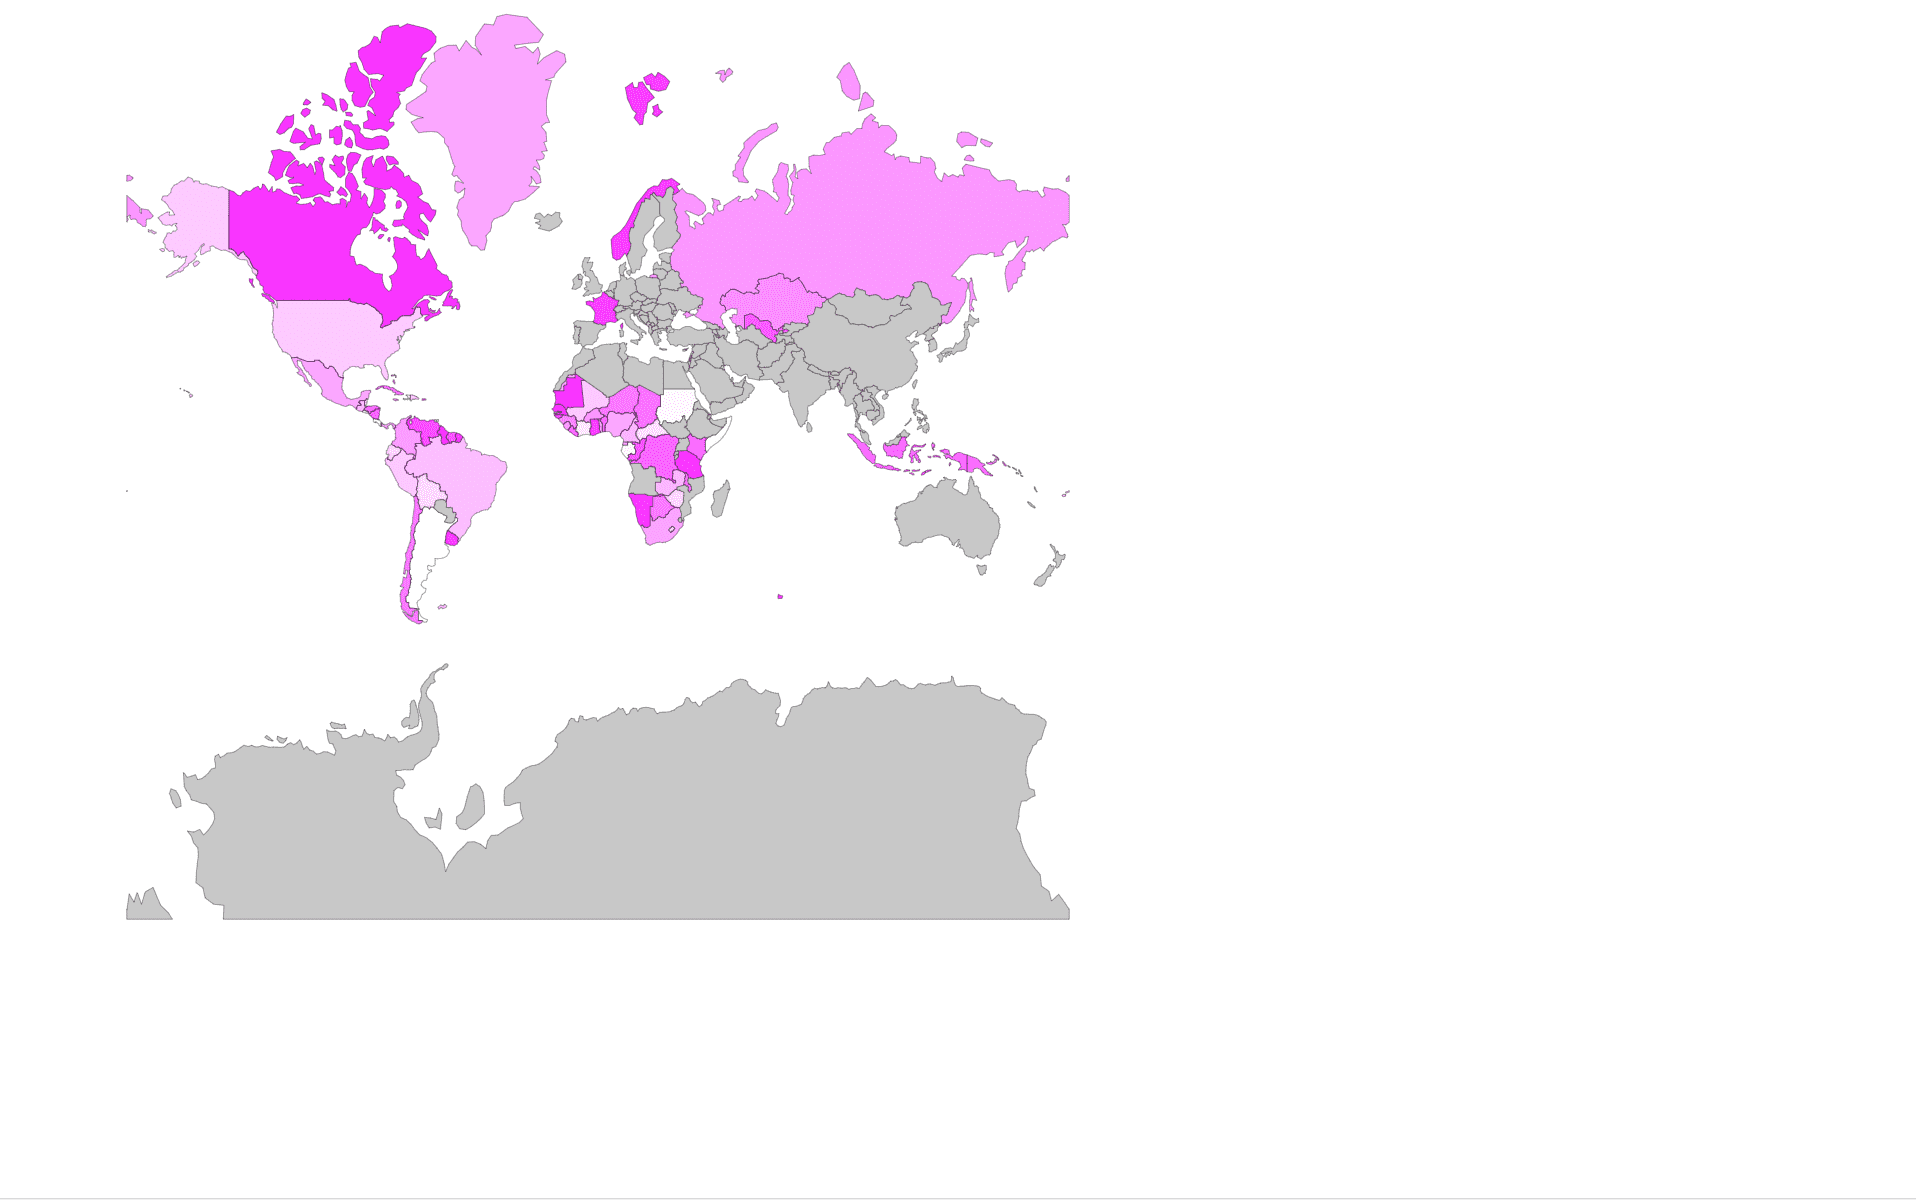
Project the Coordinates and Visualize the SVG
The changes you make below will connect the coordinates to draw each country with a series of SVGs.
Make the following changes to Map.jsx:
Map.jsx
- Define the object
countryShapesvariable in your component state with default valuenull. This will be re-initialized incomponentDidMount(). - By default, render an SVG image with a
<g />element calledcountries-group. - Until the
countryShapesstate variable is defined, don't render any<path />s within the<g />element. - After the
Mapcomponent's first render, set thecountryShapesstate variable to the features of the TopoJSON you fetched and inspected just above this code block. - The
countryShapesstate variable becomes truthy, turning eachfeatureElement, which contains the coordiate borders of each country, into an array of<path />components. - Use the Mercator projection provided by
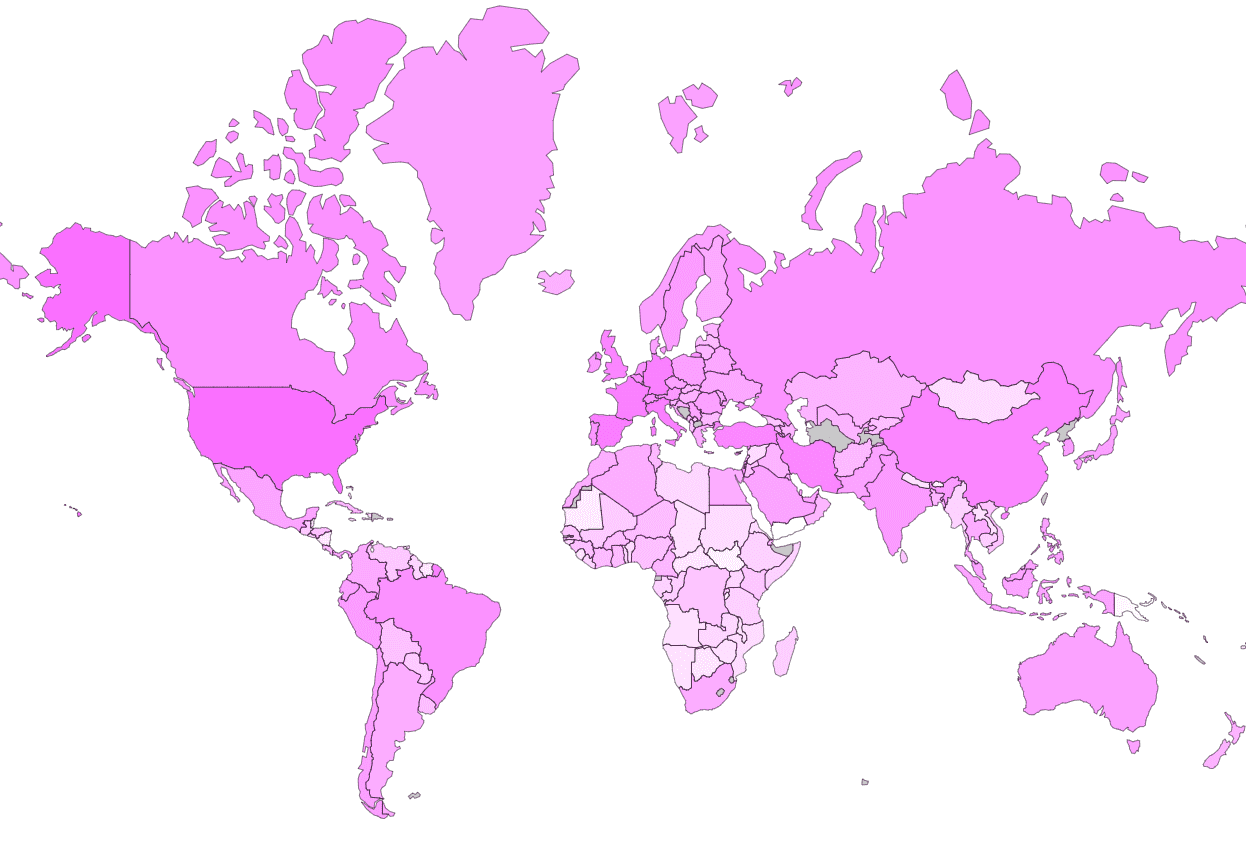
d3-geo, scale the image to 100% (instead of the default 150%) and translate the map right on the x-axis by 400 down the y-axis by 300. - The customized Mercator
projection, provided togeoPath().projection(), returns a function that takes afeatureElement. This function returnsfeatureElement's projected coordinates. Give this to<path />to draw a country's borders. - Uniformly fill each
<path />polygon with a pink color defined byrgba(255, 0, 255, 0.5).
Make the Map into a Choropleth Map
To make this a choropleth map, you will show the varying quantities of cases by country by varying base color's opacity. Let's make a helper function that uses the name of the country you pull from the TopoJSON (and sample COVID-19 case data) to produce a color.
Define the sample data below projection in Map.jsx:
const sampleData = {
  "Fiji": 3074,
  "Tanzania": 9138,
  "W. Sahara": 4143,
  "Canada": 9726,
  "United States of America": 2439,
  "Kazakhstan": 5090,
  "Uzbekistan": 7353,
  "Papua New Guinea": 6460,
  "Indonesia": 6747,
  "Argentina": 9,
  "Chile": 5864,
  "Dem. Rep. Congo": 6845,
  "Somalia": 192,
  "Kenya": 6651,
  "Sudan": 346,
  "Chad": 6251,
  "Haiti": 1143,
  "Dominican Rep.": 2436,
  "Russia": 4703,
  "Bahamas": 5904,
  "Falkland Is.": 3269,
  "Norway": 8617,
  "Greenland": 3984,
  "Fr. S. Antarctic Lands": 8599,
  "Timor-Leste": 6780,
  "South Africa": 4176,
  "Lesotho": 1642,
  "Mexico": 4020,
  "Uruguay": 8650,
  "Brazil": 2984,
  "Bolivia": 1736,
  "Peru": 2555,
  "Colombia": 4452,
  "Panama": 4131,
  "Costa Rica": 91,
  "Nicaragua": 7043,
  "Honduras": 6387,
  "El Salvador": 1059,
  "Guatemala": 3389,
  "Belize": 1865,
  "Venezuela": 7918,
  "Guyana": 9731,
  "Suriname": 7663,
  "France": 8582,
  "Ecuador": 1889,
  "Puerto Rico": 6067,
  "Jamaica": 5362,
  "Cuba": 6440,
  "Zimbabwe": 1816,
  "Botswana": 5960,
  "Namibia": 9102,
  "Senegal": 9869,
  "Mali": 2561,
  "Mauritania": 9969,
  "Benin": 6901,
  "Niger": 5985,
  "Nigeria": 4014,
  "Cameroon": 3428,
  "Togo": 4304,
  "Ghana": 8478,
  "Côte d'Ivoire": 1051,
  "Guinea": 5548,
  "Guinea-Bissau": 7992,
  "Liberia": 6675,
  "Sierra Leone": 4517,
  "Burkina Faso": 4694,
  "Central African Rep.": 1429,
  "Congo": 7581,
  "Gabon": 449,
  "Eq. Guinea": 4241,
  "Zambia": 3389,
  "Malawi": 5880,
};
Define the helper function getCountryFill() below sampleData in Map.jsx:
- If there is no value in the data, use a default gray value to indicate "no data."
- If the value is present in the array, use your pink color from before and vary the opacity.
The values in the sample data are randomly positive integers less than 10,000. For now, the opacity is arbitrarily defined by "value / 10000." You'll make this function less trivial further on.
Let's make this choropleth map happen. For your <path />, redefine the fill parameter:
...
	<path
      key={`country-svg-${index}`}
      d={geoPath().projection(projection)(featureElement)}
      className="country"
      fill={getCountryFill(featureElement)}
      stroke="black"
      strokeWidth={0.25}
    />
...

Use Updated Data
You're going to present current COVID-19 case data, so I'm not going to show any more screenshots of what you should expect your map's colors to look like. That said, let's move onto real data! Open Johns Hopkins' updated time series-confirmed case data in another tab.
Understand the Data
It may show up as a table, or it could show up raw, like this. Anyhow, take a look at the columns. See that they start with [Province/State, Country/Region, Lat, Long] and then continue with dates? This is your schema. With each day, you will (predictably) have one more column.
| Province/State | Country/Region | Lat | Long | ... | 1/22/20 | 1/23/20 | ... |
|---|
Now look at the rows. See that many start with a , (or a blank cell, if you're looking at the pretty version)? That suggests that you don't have "Province/State" breakdowns (first column) for every "Country/Region" (second column). Because the map is only specific enough to show countries, you'll reduce each countries' province's daily values into one value for the whole country; for example, Australian Capital Territory, New South Wales, Northern Territory, Queensland, South Australia, Tasmania, Victoria, and Western Australia will all count towards one total for Australia.
ARG...
Before you go ahead and start reducing, I need to point out something frustrating about this data. The country names here are different from the country names in your TopoJSON! I'll present a workaround later on, and you can take it from there. Let's grab the data.
Grab the Data
In Map.jsx, download the raw CSV data using d3.csv() and log it to the console:

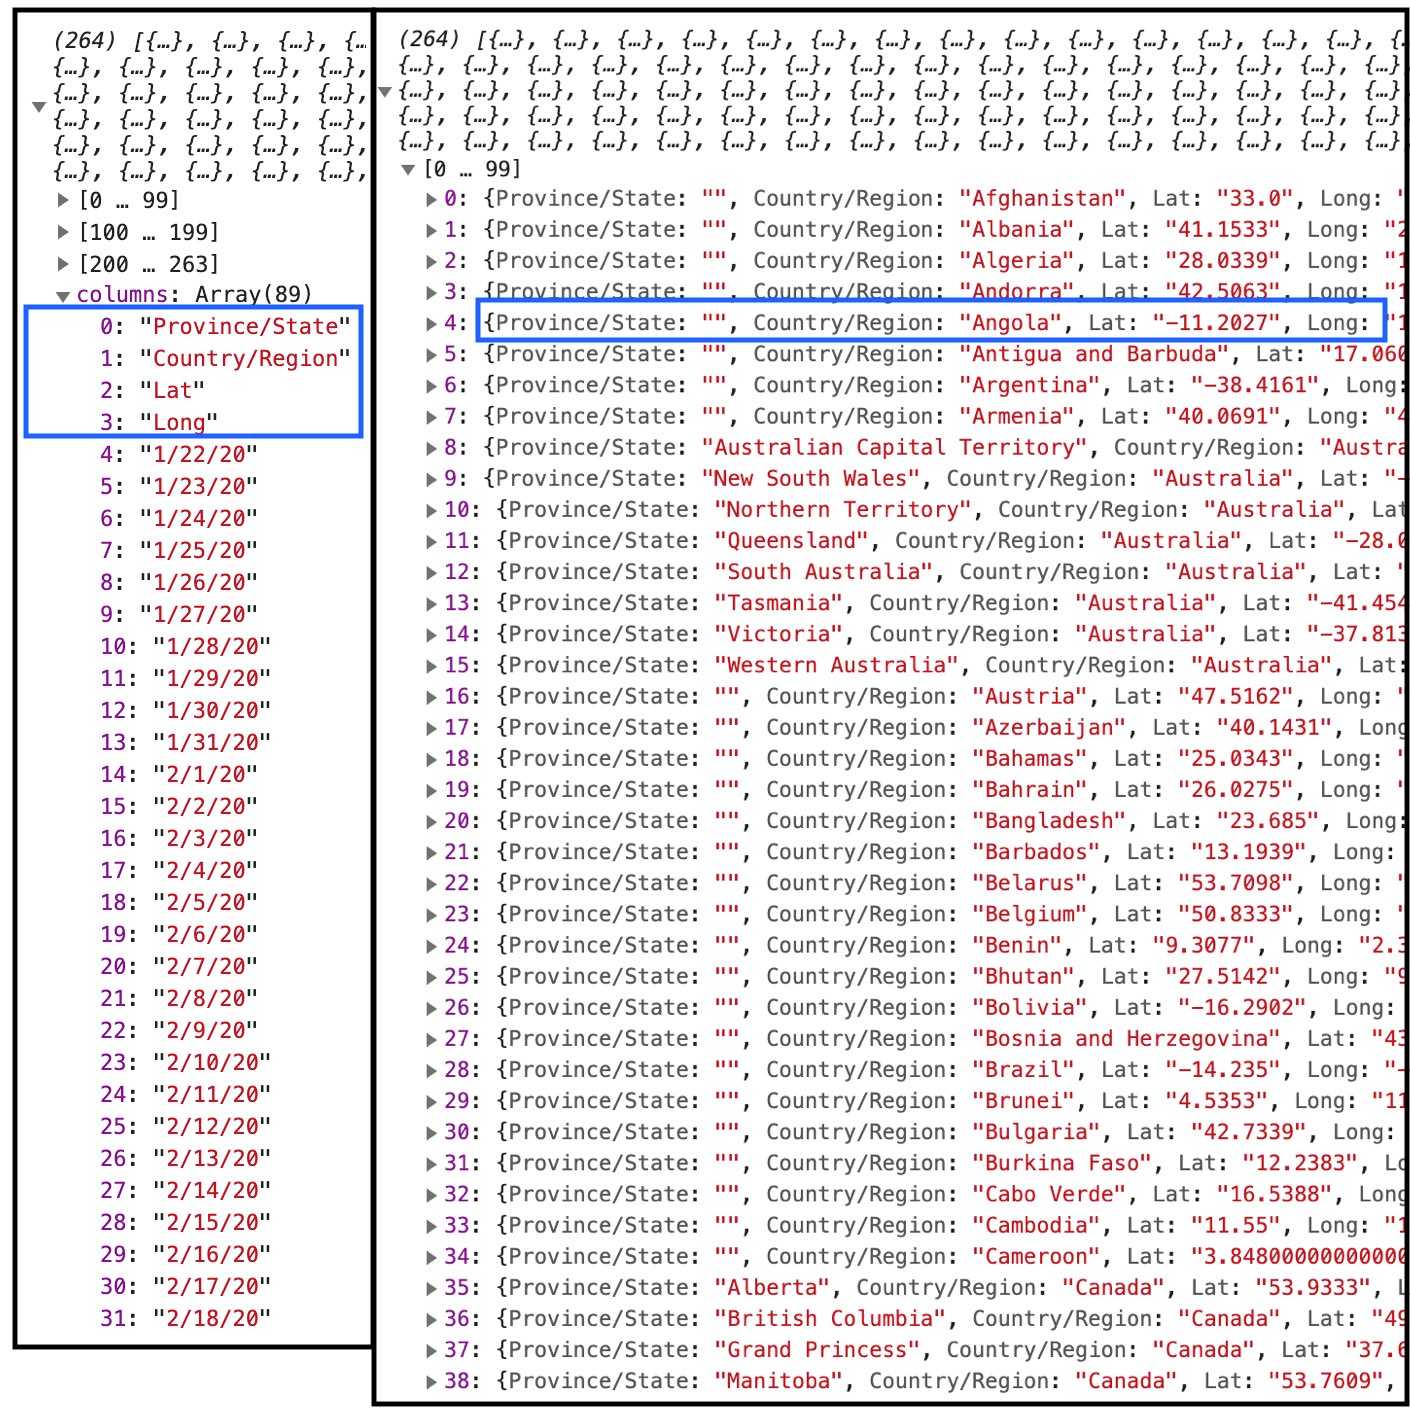
Nice! It gives us the names of the columns. All in all, the CSV data you're dealing with:
- is an array of objects wherein each key is a column name.
- has a field
columns, which is itself an array of columns names.
Moving on...
Consolidate the Data
Using the country name in each array element, reduce the last day's confirmed case count across each country's. Your Map.jsx should look something like this:
Map.jsx
import React from 'react';

import * as d3 from 'd3';
import { geoMercator, geoPath } from "d3-geo"
import { feature } from "topojson-client"

const projection = geoMercator()
  .scale(100)
  .translate([400, 300])

const sampleData = {
  ...
};

function getCountryFill(featureElement) {
  ...
}

export default class Map extends React.Component {
  constructor(props) {
    super(props);
    this.state = {
      countryShapes: null,
      countryDataset: null,
    };
  }

  // 1
  async componentDidMount() {
    var countryShapes = null;
    var countryDataset = null;
    // 2
    await d3.json("https://cdn.jsdelivr.net/npm/world-atlas@2/countries-110m.json")
      .then(async (json) => {
        countryShapes = feature(json, json.objects.countries).features;
        // 3
        await d3.csv("https://raw.githubusercontent.com/CSSEGISandData/COVID-19/master/csse_covid_19_data/csse_covid_19_time_series/time_series_covid19_confirmed_global.csv")
          .then(csvData => {
            // 4
            countryDataset = {};
            let latestDate = csvData.columns[csvData.columns.length - 1];
            csvData.forEach(province => {
              let countryName = province["Country/Region"];
              let caseCount = province[latestDate];
              if (countryDataset[countryName] === undefined) {
                countryDataset[countryName] = Number.parseInt(caseCount);
              } else {
                countryDataset[countryName] += Number.parseInt(caseCount);
              }
            })
          });
      });

    // 5
    this.setState({
      countryShapes: countryShapes,
      countryDataset: countryDataset,
    });
  }

  render() {
    ...
  }
}
- Stick an
asyncin front ofcomponentDidMount()to make sure you don'tsetState()withnullvalues, i.e. wait to complete the promise. - Wait for the
d3.json()call to complete. - Wait for the
d3.csv()call to complete. - Reduce the dataset to map of (key: Country Name, value: Cases) pairs
- Set the dataset to a new state variable,
countryDataset
You can try to use your fancy new countryDataset as reference data for your choropleth map, so if you go ahead and give it a try...
Map.jsx
- const sampleData = {
-   "Fiji": 3074,
-   ...
-   "Malawi": 5880,
- };

- function getCountryFill(featureElement) {
+ function getCountryFill(referenceData, featureElement) {
    let name = featureElement.properties.name;
-   let value = sampleData[name];
+   let value = referenceData[name];

...

-  fill={getCountryFill(featureElement)}
+  fill={getCountryFill(this.state.countryDataset, featureElement)}
...you'll see it doesn't work out so well. Even the USA is missing data. If you went down the road above, go ahead and keep your changes. You'll build on them soon.
To fill in the gaps, you need to set the dataset's country names to those used in the TopoJSON. Add this workaround above the setState() statement in Map.jsx's componentDidMount() function:
async componentDidMount() {
  var countryShapes = null;
  var countryDataset = null;
  await d3.json("https://cdn.jsdelivr.net/npm/world-atlas@2/countries-110m.json")
    .then(async (json) => {
      ...
    });

+ // Left: the name of the country as indicated in the TopoJSON
+ // Right: the name of the country as indicated in the JHU CSSE case data
+ countryDataset["United States of America"] = countryDataset["US"];
+ countryDataset["Greenland"] = countryDataset["Denmark"];
+ countryDataset["Congo"] = countryDataset["Congo (Brazzaville)"];
+ countryDataset["Dem. Rep. Congo"] = countryDataset["Congo (Kinshasa)"];
+ countryDataset["Central African Rep."] = countryDataset["Central African Republic"];
+ countryDataset["S. Sudan"] = countryDataset["South Sudan"];
+ countryDataset["Côte d'Ivoire"] = countryDataset["Cote d'Ivoire"];
+ countryDataset["Myanmar"] = countryDataset["Burma"];
+ countryDataset["South Korea"] = countryDataset["Korea, South"];

  this.setState({
    ...
  });
}
Look at your map render. Some, but not all previously gray countries should now be some shade of pink; but oh no! Your outdated opacity function makes country case-quantities indistinguishable! Let's revise it.
Final Touches
Change the following in Map.jsx':
  function getCountryFill(referenceData, featureElement) {
	  let name = featureElement.properties.name;
	  let value = referenceData[name];
	  if (value) {
-	    let opacity = value / 10000;
+	    let opacity = Math.log(value) / Math.log(8) / 10;
	    return `rgba(255, 0, 255, ${opacity})`;
	  }
	  return `rgba(200, 200, 200, 1)`;
  }
Your map shows the most updated Johns Hopkins University confirmed cases.
Acknowledgements
Thanks to Richard Zimerman for the basemap instructions and the Center For Systems Science and Engineering at JHU.